UBS says there are 8 warning signs of a stock market bubble…
And six of them have already flashed.
In a new note for clients…
UBS strategist Andrew Garthwaite outlined the eight warning signs of a stock market bubble.
Here they are.
1. The end of a structural bull market – FLASHED
Garthwaite says that bubbles happen when stock market returns are much higher than bond returns.
Investors then assume these high returns will continue…
When in fact future returns often fall far below average.
2. When profits are under pressure – FLASHED
S&P 500 profits have been booming for the past year.
But Garthwaite says NIPA profits are important too.
NIPA profits are the total profits of businesses in the U.S., calculated by the National Income and Product Accounts, which measure the overall economy’s income and output.
Take a look at this chart…
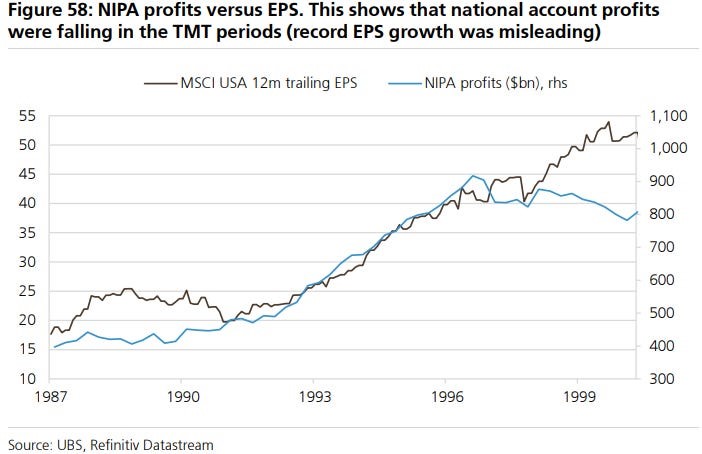
As you can see…
NIPA profits fell while stock market profits rose right before the Tech Wreck of 2000.
“The same was true in Japan in the late 1980s,” Garthwaite said.
3. Large loss of breadth – FLASHED
When only a few companies are causing most of the stock market gains…
It means the market is not strong overall.
Right now, big tech stocks are leading.
But most other stocks are not doing well.
Garthwaite said this is clear when we compare the number of rising stocks to falling stocks against the S&P 500 during the TMT period.
4. Needs a 25-year gap from the prior bubble – FLASHED
This allows many investors to think “this time is different”…
… and come up with ideas that stocks should have a permanently lower equity risk premium.
5. Has a 25-year gap from prior bubble – FLASHED
Garthwaite also pointed out that market bubbles often center around dominance or groundbreaking technology.
In the 19th century, it was railways.
In the 20th century, the excitement came from mass production of cars, city electrification, and the radio – leading to a major bubble in 1929.
Today we see a similar pattern with big tech companies driving the market.
Like past bubbles, today’s market is highly focused on big tech companies.
Just as railways and cars drove market excitement and speculation…
Now it’s tech companies causing a high concentration in the market.
Remember: The last major bubble burst in 2000—almost 25 years ago.
Is history about to rhyme again?
6. Retail starts to participate aggressively – FLASHED
When retail investors heavily buy stocks…
It pushes the equity risk premium down and drives valuations up.
Garthwaite noted this is evident in the unusually high bull/bear ratio of individual investors.
7. Monetary policy being too loose – HASN’T FLASHED
Previous bubbles happened when real interest rates dropped significantly.
This hasn’t happened yet because the Fed hasn’t cut interest rates.
Garthwaite mentioned that current monetary conditions are unusually tight compared to the output gap.
8. Extended period of limited declines – HASN’T FLASHED
Previous stock market bubbles had years with few sell-offs under 20%.
However, with the S&P 500 dropping over 25% in 2022 and experiencing a major sell-off in 2020…
We may still have a long way to go before seeing similar conditions.
Now, nobody truly knows what will happen next.
Yours in Wealth,
Ian Wyatt